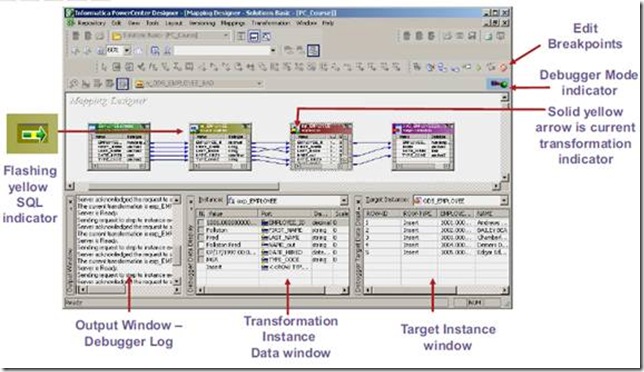
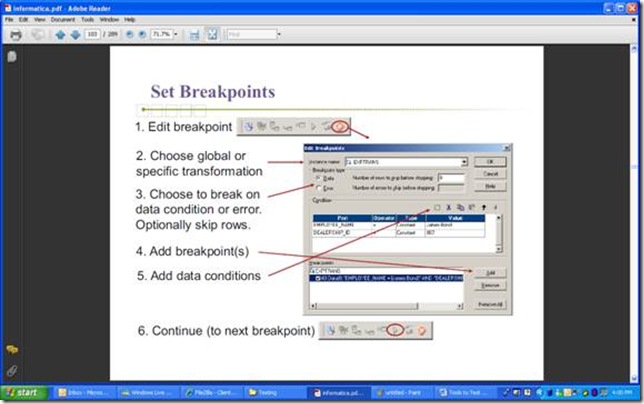
You can debug a valid mapping to gain troubleshooting information about data and error conditions. To debug a mapping, you configure and run the Debugger from within the Mapping Designer. The Debugger uses a session to run the mapping on the Integration Service. When you run the Debugger, it pauses at breakpoints and you can view and edit transformation output data.
You might want to run the Debugger in the following situations:
- Before you run a session. After you save a mapping, you can run some initial tests with a debug session before you create and configure a session in the Workflow Manager.
- After you run a session. If a session fails or if you receive unexpected results in the target, you can run the Debugger against the session. You might also want to run the Debugger against a session if you want to debug the mapping using the configured session properties.
Debugger Session Types:
You can select three different debugger session types when you configure the Debugger. The Debugger runs a workflow for each session type. You can choose from the following Debugger session types when you configure the Debugger:
- Use an existing non-reusable session. The Debugger uses existing source, target, and session configuration properties. When you run the Debugger, the Integration Service runs the non-reusable session and the existing workflow. The Debugger does not suspend on error.
- Use an existing reusable session. The Debugger uses existing source, target, and session configuration properties. When you run the Debugger, the Integration Service runs a debug instance of the reusable session And creates and runs a debug workflow for the session.
- Create a debug session instance. You can configure source, target, and session configuration properties through the Debugger Wizard. When you run the Debugger, the Integration Service runs a debug instance of the debug workflow and creates and runs a debug workflow for the session.
Debug Process
To debug a mapping, complete the following steps:
1. Create breakpoints. Create breakpoints in a mapping where you want the Integration Service to evaluate data and error conditions.
2. Configure the Debugger. Use the Debugger Wizard to configure the Debugger for the mapping. Select the session type the Integration Service uses when it runs the Debugger. When you create a debug session, you configure a subset of session properties within the Debugger Wizard, such as source and target location. You can also choose to load or discard target data.
3. Run the Debugger. Run the Debugger from within the Mapping Designer. When you run the Debugger, the Designer connects to the Integration Service. The Integration Service initializes the Debugger and runs the debugging session and workflow. The Integration Service reads the breakpoints and pauses the Debugger
when the breakpoints evaluate to true.
4. Monitor the Debugger. While you run the Debugger, you can monitor the target data, transformation and mapplet output data, the debug log, and the session log. When you run the Debugger, the Designer displays the following windows:
- Debug log. View messages from the Debugger.
- Target window. View target data.
- Instance window. View transformation data.
5. Modify data and breakpoints. When the Debugger pauses, you can modify data and see the effect on transformations, mapplets, and targets as the data moves through the pipeline. You can also modify breakpoint information.
The Designer saves mapping breakpoint and Debugger information in the workspace files. You can copy breakpoint information and the Debugger configuration to another mapping. If you want to run the Debugger from another Power Center Client machine, you can copy the breakpoint information and the Debugger configuration to the other Power Center Client machine.
Running the Debugger:
When you complete the Debugger Wizard, the Integration Service starts the session and initializes the Debugger. After initialization, the Debugger moves in and out of running and paused states based on breakpoints and commands that you issue from the Mapping Designer. The Debugger can be in one of the following states:
- Initializing. The Designer connects to the Integration Service.
- Running. The Integration Service processes the data.
- Paused. The Integration Service encounters a break and pauses the Debugger.
Note: To enable multiple users to debug the same mapping at the same time, each user must configure different port numbers in the Tools > Options > Debug tab.
The Debugger does not use the high availability functionality.
Monitoring the Debugger :
When you run the Debugger, you can monitor the following information:
- Session status. Monitor the status of the session.
- Data movement. Monitor data as it moves through transformations.
- Breakpoints. Monitor data that meets breakpoint conditions.
- Target data. Monitor target data on a row-by-row basis.
The Mapping Designer displays windows and debug indicators that help you monitor the session:
- Debug indicators. Debug indicators on transformations help you follow breakpoints and data flow.
- Instance window. When the Debugger pauses, you can view transformation data and row information in the Instance window.
- Target window. View target data for each target in the mapping.
- Output window. The Integration Service writes messages to the following tabs in the Output window:
- Debugger tab. The debug log displays in the Debugger tab.
- Session Log tab. The session log displays in the Session Log tab.
- Notifications tab. Displays messages from the Repository Service.
While you monitor the Debugger, you might want to change the transformation output data to see the effect on subsequent transformations or targets in the data flow. You might also want to edit or add more breakpoint information to monitor the session more closely.
Restrictions
You cannot change data for the following output ports:
- Normalizer transformation. Generated Keys and Generated Column ID ports.
- Rank transformation. RANKINDEX port.
- Router transformation. All output ports.
- Sequence Generator transformation. CURRVAL and NEXTVAL ports.
- Lookup transformation. NewLookupRow port for a Lookup transformation configured to use a dynamic cache.
- Custom transformation. Ports in output groups other than the current output group.
- Java transformation. Ports in output groups other than the current output group.
Additionally, you cannot change data associated with the following:
- Mapplets that are not selected for debugging
- Input or input/output ports
- Output ports when the Debugger pauses on an error breakpoint


No comments:
Post a Comment
Thank you :
- kareem